This Machine Makes Seltzer
Let’s say you have a parallel query running at DOP 4. The final logic of the query is some aggregate: COUNT, SUM, MIN, MAX, whatever.
Sure, the optimizer could gather all the streams, and then calculate one of those for all four of them, but why do that?
We have a Partial Aggregate operator that allows an aggregate per thread to be locally aggregated, then a final global aggregate can be more quickly calculated from the four locally aggregated values.
There are a couple odd things about Partial Aggregates though:
- They ask for a fixed amount of memory, which is usually quite small
- When they run out of memory, they don’t spill, they just stop aggregating
Which is why for identical executions of identical queries, you may see different numbers of rows come out of them.

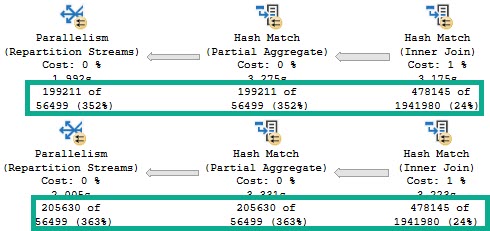
We start with the same number of rows coming out of the Hash Join, which is expected.
We ran the same query.
However, the Partial Aggregate emits different numbers of rows.
It doesn’t matter much, because the global aggregate later in the plan will still be able to figure things out, albeit slightly less efficiently.

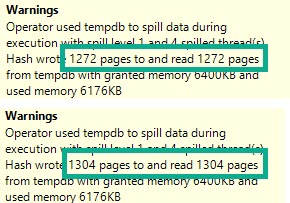
If we look at the spills in the Hash Match Aggregates from both of the above plans, the warnings are slightly different.

Hardly anything to worry about here, of course. But definitely something to be aware of.
No, SQL Server isn’t leaking memory, or full of bugs. It’s just sensitive.
Thanks for reading!
Going Further
If this is the kind of SQL Server stuff you love learning about, you’ll love my training. I’m offering a 75% discount to my blog readers if you click from here. I’m also available for consulting if you just don’t have time for that and need to solve performance problems quickly.