Mama, I Tried
Back when I first wrote sp_BlitzQueryStore, I was totally enamored with Query Store.
Like the plan cache, but better. History. Different plans for the same query. Not disturbed by memory pressure or restarts.
Then I waited patiently to find a client on 2016 using it.
And waited, and waited, and waited.
And finally, some came along.
Slow Pokes And No Pokes
When I ran it, it took forever. Not even the XML part. The XML part was fast.
Gathering the initial set of data was slow.
With some time to experiment and dig in, I found that the IN_MEM tables cause significant performance issues when:
- Query Store is actively logging data
- Query Store is > 25 MB or so
Yes, children, in memory tables can be slow, too.
The Problem
Let’s take a couple simple queries against Query Store tables:
SELECT TOP 10 *
FROM sys.query_store_runtime_stats AS qsrs
WHERE qsrs.avg_cpu_time >= 500000
AND   qsrs.last_execution_time >= DATEADD(DAY, -1, GETDATE())
ORDER BY qsrs.avg_cpu_time DESC;

SELECT TOP 10 *
FROM sys.query_store_plan AS qsp
WHERE qsp.query_plan IS NOT NULL
AND   qsp.last_execution_time >= DATEADD(DAY, -1, GETDATE())
ORDER BY qsp.last_execution_time DESC;
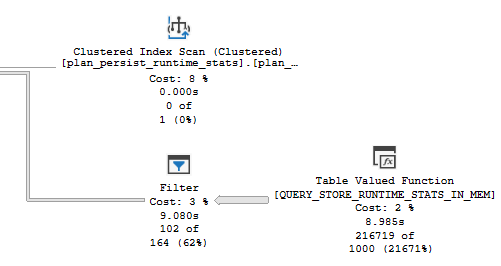
The first query runs for 10 seconds, with the entirety of the time spent filtering data out of the IN_MEM table:
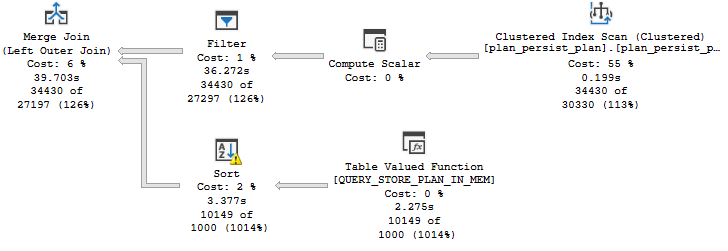
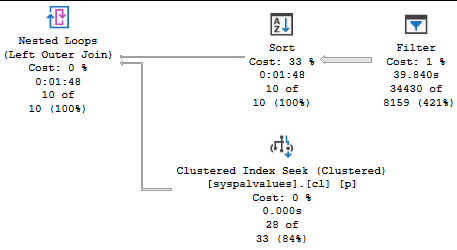
The second query is even worse, at nearly 2 minutes:
“Unrealistic”
I know, this configuration is probably unsupported because I used SELECT * or something.
I wrote this query hoping to quickly get the worst plans by a specific metric.
WITH the_pits
    AS
     (
         SELECT   TOP ( 101 )
                  qsrs.plan_id,
                  qsp.query_id,
                  qsrs.avg_duration / 100000. AS avg_duration_s,
                  qsrs.avg_cpu_time / 100000. AS avg_cpu_time_s,
                  qsrs.avg_query_max_used_memory,
                  qsrs.avg_logical_io_reads,
                  qsrs.avg_logical_io_writes,
                  qsrs.avg_tempdb_space_used,
                  qsrs.last_execution_time,
                  /*
                  You can stick any of the above metrics in here to
                  find offenders by different resource abuse
                  */
                  MAX(qsrs.avg_cpu_time) OVER
                  (
                      PARTITION BY
                          qsp.query_id
                      ORDER BY
                          qsp.query_id
                      ROWS UNBOUNDED PRECEDING
                  ) AS n
         FROM     sys.query_store_runtime_stats AS qsrs
         JOIN     sys.query_store_plan AS qsp
             ON qsp.plan_id = qsrs.plan_id
         WHERE    qsrs.avg_duration >= ( 5000. * 1000. )
         AND      qsrs.avg_cpu_time >= ( 1000. * 1000. )
         AND      qsrs.last_execution_time >= DATEADD(DAY, -7, GETDATE())
         AND      qsp.query_plan IS NOT NULL
         /*
         Don't forget to change this to same thing!
         */
         ORDER BY qsrs.avg_cpu_time DESC
     )
SELECT   p.plan_id,
         p.query_id,
         p.avg_duration_s,
         p.avg_cpu_time_s,
         p.avg_query_max_used_memory,
         p.avg_logical_io_reads,
         p.avg_logical_io_writes,
         p.avg_tempdb_space_used,
         p.last_execution_time,
         qsqt.query_sql_text,
         TRY_CONVERT(XML, qsp.query_plan) AS query_plan
FROM     sys.query_store_plan AS qsp
JOIN     the_pits AS p
    ON p.plan_id = qsp.plan_id
JOIN     sys.query_store_query AS qsq
    ON qsq.query_id = qsp.query_id
JOIN     sys.query_store_query_text AS qsqt
    ON qsq.query_text_id = qsqt.query_text_id
ORDER BY p.n DESC;
It works pretty well. Sometimes.
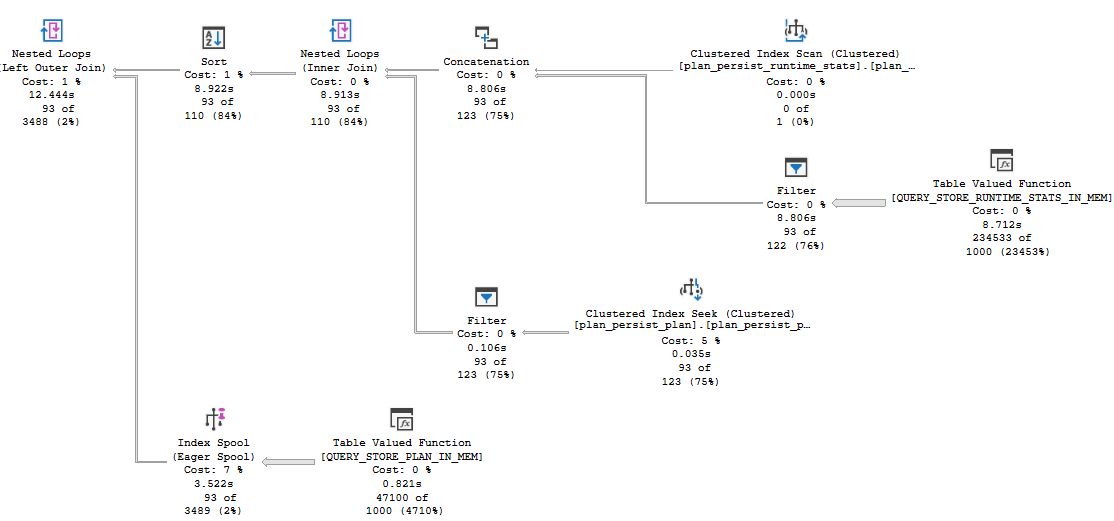
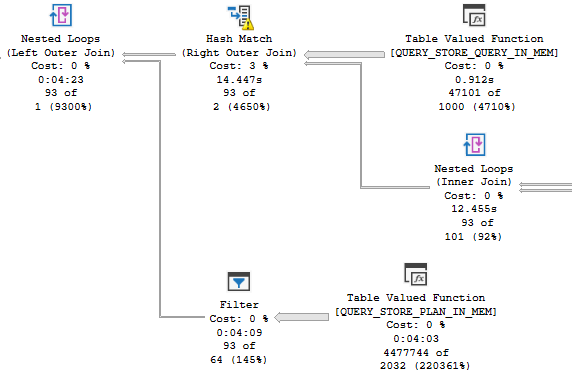
Other times, it runs for 4.5 minutes.
I know what you’re thinking: “Erik, you’re doing all sorts of crazy stuff in there. You’re making it slow.”
But none of the crazy stuff I’m doing is where the slowdown is.
It’s all in the same stuff I pointed out in the simpler queries.
Testing, testing
I can’t stress how much I want Query Store to be successful. I absolutely love the idea.
But it just wasn’t implemented very well. Simple filtering against the data takes forever.
And yes, you can have NULL query plans for some reason. That’s rich.
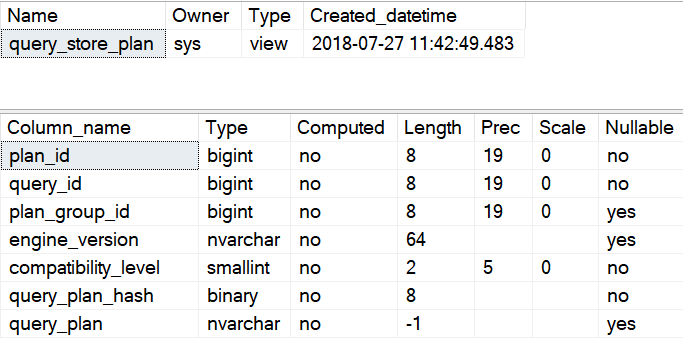
Usability issues don’t stop there. You can hit weird server performance issues, and reports are broken.
The irony of needing to tune queries so you can find queries to tune is ironic.
I’m nearly sure of it.
Thanks for reading!
Going Further
If this is the kind of SQL Server stuff you love learning about, you’ll love my training. I’m offering a 75% discount to my blog readers if you click from here. I’m also available for consulting if you just don’t have time for that and need to solve performance problems quickly.
“The irony of needing to tune queries so you can find queries to tune is ironic.”
????
Definitely — if you create a user voice issue, I and my team would love to vote on it.
Was reading this blog post by Jovan
https://blogs.msdn.microsoft.com/sqlserverstorageengine/2019/03/05/analyzing-wait-statistics-on-managed-instance/
and saw a reference to this github project
https://github.com/JocaPC/qpi
& knew you’d written about wanting something similar – so thought I’d add a comment and bring it to your attention
Ooh, neat, I’ll check those out! Jovan is a smart fella.
Thanks!