Cumulative Noopdate
In yesterday’s post, I talked through how I capture blocking using sp_HumanEvents. Today I’m going to talk about a couple different ways I use it to capture query performance issues.
One thing I want to stress is that you shouldn’t use yesterday’s technique to gather query performance issues. One thing sp_HumanEvents does is capture actual execution plans, and that can really bog a server down if it’s busy.
I tend to use it for short periods of time, or for very targeted data collection against a single stored procedure or session id running things.
I’ve occasionally toyed with the idea of adding a flag to not get query plans, or to use a different event to get them.
I just don’t think there’s enough value in that to be worthwhile since the actual execution plan has so many important details that other copies do not.
So anyway, let’s do a thing.
Whole Hog
You can totally use sp_HumanEvents to grab absolutely everything going on like this:
EXEC sp_HumanEvents
    @event_type = 'query',
    @query_duration_ms = 5000,
    @seconds_sample = 20;
You may need to do this in some cases when you’re first getting to know a server and need to get a feeling for what’s going on. This will show you any query that takes 5 seconds or longer in the 20 second window the session is alive for.
If you’re on a really busy server, it can help to cut down on how much you’re pulling in:
EXEC sp_HumanEvents
    @event_type = 'query',
    @query_duration_ms = 5000,
    @seconds_sample = 20,
    @sample_divisor = '5';
This will only pull in data from sessions if their spid is divisible by 5. The busier your server is, the weirder you might want to make this number, like 15/17/19 or something.
Belly
Much more common for me is to be on a development server, and want to watch my spid as I execute some code:
EXEC sp_HumanEvents
    @event_type = 'query',
    @query_duration_ms = 10000,
    @session_id = N'58',
    @keep_alive = 1;
This is especially useful if you’re running a big long stored procedure that calls a bunch of other stored procedures, and you want to find all the statements that take a long time without grabbing every single query plan.
If you’ve ever turned on Actual Execution Plans and tried to do this, you might still be waiting for SSMS to become responsive again. It’s really painful.
By only grabbing query details for things that run a long time, you cut out all the little noisy queries that you can’t really tune.
I absolutely adore this, because it lets me focus in on just the parts that take a long time.
Shoulder
One pretty common scenario is for clients to give me a list of stored procedures to fix. If they don’t have a monitoring tool, it can be a challenge to understand things like:
- How users call the stored procedure normally
- If the problem is parameter sniffing
- Which queries in the stored procedure cause the biggest problems
We can do that like so:
EXEC sp_HumanEvents
    @event_type = 'query',
    @query_duration_ms = 5000,
    @keep_alive = 1,
    @object_schema = 'dbo',
    @object_name = 'TheWorstStoredProcedureEverWritten';
This will only collect sessions executing a single procedure. I’ll sometimes do this and work through the list.
Hoof
There are some slight differences in how I call the procedure in different circumstances.
- When I use the
@seconds_sampleparameter, sp_HumanEvents will run for that amount of time and then spit out a result - When I use the
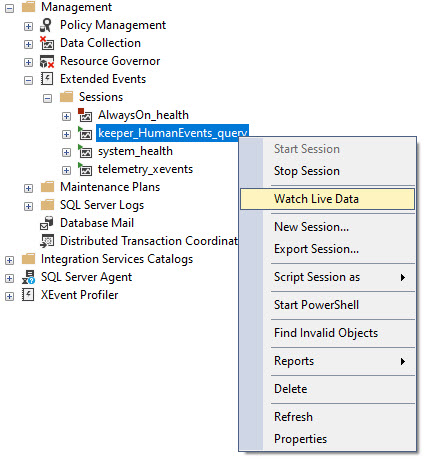
@keep_aliveparameter, all that happens is a session gets created and you need to go watch live data like this:

Just make sure you do that before you start running your query, or you might miss something important.
Thanks for reading!
Going Further
If this is the kind of SQL Server stuff you love learning about, you’ll love my training. I’m offering a 75% discount to my blog readers if you click from here. I’m also available for consulting if you just don’t have time for that, and need to solve database performance problems quickly. You can also get a quick, low cost health check with no phone time required.