Let’s Not Kid Ourselves
There are lots of things that can go wrong with SQL Server, performance-wise. Just about anything can fly off the handle.
Recently, I was handing out a passing thought on Twitter that caught the attention of the beloved and venerable Michael J Swart (b|t):
logical reads are the new fragmentation.
— Erik Darling Data (@erikdarlingdata) May 17, 2022
We got to Twalking a little bit about why I said that, too, and he found what I usually find when I start comparing things.
Hmmm… not as correlated as I thought pic.twitter.com/FTRcrjhWTE
— Michael J Swart (@MJSwart) May 17, 2022
Scripty Kid
I decided to expand on some scripts to look at how queries use CPU and perform reads, and found some really interesting stuff. I’ll talk through some results and how I’d approach tuning them afterwards.
Here are the queries:
/*Queries that do no logical reads, but lots of CPU work*/
SELECT TOP (100)
    total_logical_reads =
        FORMAT(qs.total_logical_reads, 'N0'),
    total_worker_time_ms =
        FORMAT(qs.total_worker_time / 1000., 'N0'),
    execution_count =
        FORMAT(qs.execution_count, 'N0'),
    query_text =
        SUBSTRING
        (
            st.text,
            qs.statement_start_offset / 2 + 1,
            CASE qs.statement_start_offset
                 WHEN -1
                 THEN DATALENGTH(st.text)
                 ELSE qs.statement_end_offset
            END - qs.statement_start_offset / 2 + 1
        ),
    qp.query_plan
FROM sys.dm_exec_query_stats AS qs
CROSS APPLY sys.dm_exec_sql_text(qs.sql_handle) AS st
CROSS APPLY sys.dm_exec_query_plan(qs.plan_handle) AS qp
WHERE qs.total_logical_reads = 0
AND   qs.total_worker_time > 5000
ORDER BY qs.total_worker_time DESC;

/*Queries that do 2x more reads than CPU work*/
SELECT TOP (100)
    total_logical_reads =
        FORMAT(qs.total_logical_reads, 'N0'),
    total_worker_time_ms =
        FORMAT(qs.total_worker_time / 1000., 'N0'),
    execution_count =
        FORMAT(qs.execution_count, 'N0'),
    query_text =
        SUBSTRING
        (
            st.text,
            qs.statement_start_offset / 2 + 1,
            CASE qs.statement_start_offset
                 WHEN -1
                 THEN DATALENGTH(st.text)
                 ELSE qs.statement_end_offset
            END - qs.statement_start_offset / 2 + 1
        ),
    qp.query_plan
FROM sys.dm_exec_query_stats AS qs
CROSS APPLY sys.dm_exec_sql_text(qs.sql_handle) AS st
CROSS APPLY sys.dm_exec_query_plan(qs.plan_handle) AS qp
WHERE qs.total_logical_reads > (qs.total_worker_time * 2)
ORDER BY qs.total_logical_reads DESC;

/*Queries that do 4x more CPU work than reads*/
SELECT TOP (100)
    total_logical_reads =
        FORMAT(qs.total_logical_reads, 'N0'),
    total_worker_time_ms =
        FORMAT(qs.total_worker_time / 1000., 'N0'),
    execution_count =
        FORMAT(qs.execution_count, 'N0'),
    query_text =
        SUBSTRING
        (
            st.text,
            qs.statement_start_offset / 2 + 1,
            CASE qs.statement_start_offset
                 WHEN -1
                 THEN DATALENGTH(st.text)
                 ELSE qs.statement_end_offset
            END - qs.statement_start_offset / 2 + 1
        ),
    qp.query_plan
FROM sys.dm_exec_query_stats AS qs
CROSS APPLY sys.dm_exec_sql_text(qs.sql_handle) AS st
CROSS APPLY sys.dm_exec_query_plan(qs.plan_handle) AS qp
WHERE qs.total_worker_time > (qs.total_logical_reads * 4)
ORDER BY qs.total_worker_time DESC;
Resultant
A quick note about these is that the comparison between CPU and logical reads happens in the where clause, and I convert CPU time to milliseconds in the select list.
That might make the number look a little funny, but it makes them somewhat more easy to understand than microseconds in the grand scheme of things.
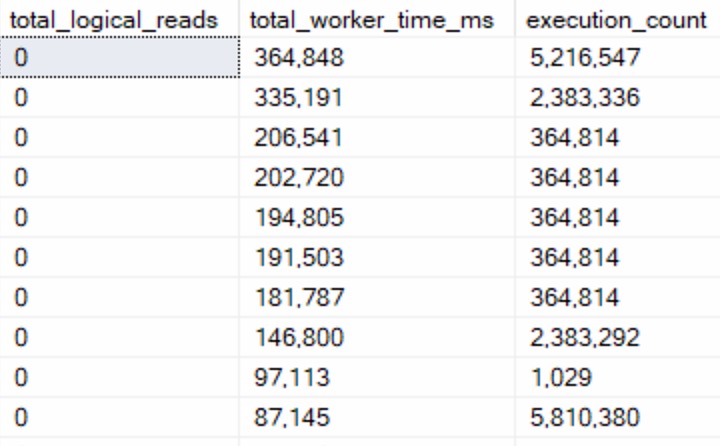
First, queries that do no logical reads but use CPU time:

A lot of these were functions that processed input but didn’t touch data. Assembling and splitting string lists, XML, other variable assignment tasks, and occasionally DMV queries.
The “easy” button here is to stop using scalar and multi-statement functions so much. Those execution counts are hideous.
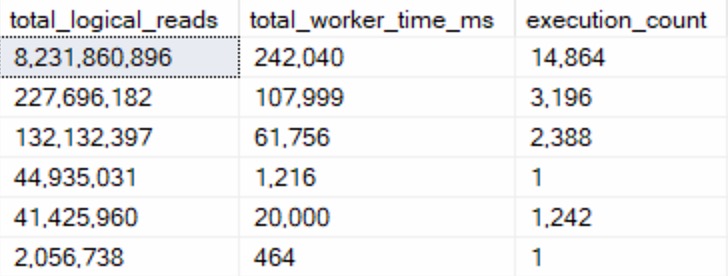
Second, queries that do 2x more reads than CPU work:

I only found six of these, while the other two categories easily found the 100 row goal.
The queries in here largely seemed to either be:
- Insert queries to temporary objects
- Queries with parameter sniffing issues
Looking at these, the problem was largely the optimizer choosing Nested Loops joins when it really shouldn’t have. The worst part was that it wasn’t an indexing issue — every single one of these queries was doing seeks across the board — they were just happening in a serial plan, and happening way more than the optimizer estimated they would. Perhaps this is something that Adaptive Joins or Batch Mode more generally could have intervened in.
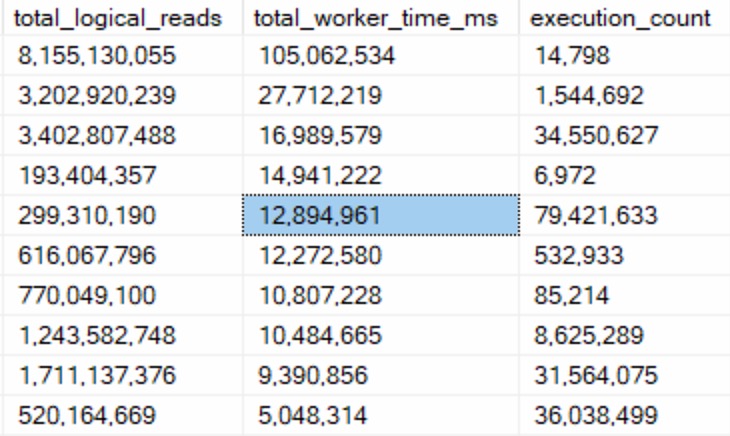
Third, queries that do 2x more CPU work than reads:

These queries were far more interesting from a tuning perspective, because there were obvious ineffiencies:
- No good indexes to use
- Large scans because of non-SARGable predicates
- Predicate Key Lookups
But the important thing here is that these queries were able to do a lot of logical reads quickly — data they needed was already in memory — and just push the hell out of CPUs.
These are the queries you can have a field day fixing and making people happy.
Residuals
This selection of query results is why I tend to ignore logical reads and focus on CPU. I do still look at things like physical reads, and select queries that do suspicious amounts of writes.
- Physical reads means going to disk, and disk is your mortal enemy
- Select queries doing writes often indicate spools and spills, which can also be pretty bad
You may not like it, but this is what peak performance tuner looks like.
Thanks for reading!
Going Further
If this is the kind of SQL Server stuff you love learning about, you’ll love my training. I’m offering a 75% discount to my blog readers if you click from here. I’m also available for consulting if you just don’t have time for that and need to solve performance problems quickly.
Related Posts
- Getting Parameter Values From A SQL Server Query Plan For Performance Tuning
- How OPTIMIZE FOR UNKNOWN Makes Troubleshooting SQL Server Performance Problems Harder
- Why You Should Stop Looking At Query Costs In SQL Server
- Common Table Expressions Are Useful For Rewriting Scalar Functions In SQL Server
2 more CPU work than reads should probably have been 4 more CPU work than reads.
And you compare microseconds to disk I/O, but list it in milliseconds. That confused me for too long.
So I changed
total_logical_reads = FORMAT(qs.total_logical_reads, ‘N0’),
to
total_logical_reads_k = FORMAT(qs.total_logical_reads/ 1000., ‘N0’),
Then I can compare too many millions to many millions, and start looking to improve things.
Thank you very much for posting.