Shorty
This is a short post. I know you’ve been somewhat spoiled by longer posts and videos lately!
Just kidding, y’all don’t pay attention (with the exception of Kevin Feasel), so maybe this will be consumable enough for even the most squirrel brained amongst us.
A long time ago, I complained that wait stats logged by actual execution plans don’t show lock waits. That seemed like a pretty big deal, because if you’re running a query and wondering why sometimes it’s fast and sometimes it’s slow, that could be a pretty huge hint.
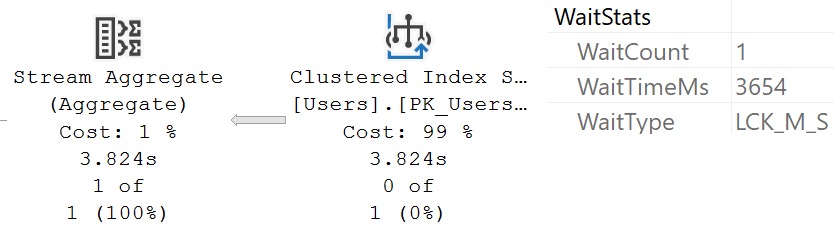
But now, if you run a query that experienced lock waits, you can see that in the details. Just highlight the root operator, hit F4 or right click and go to Properties, and look under the wait stats node, you’ll see this:
- When did this get added? I have no idea.
- How far was it back ported? I have no idea.
I could look on VMs with older versions of SQL Server, but it’s dinner time. Or as they call it in Saskatchewan, “supper”.
Thanks for reading!
Going Further
If this is the kind of SQL Server stuff you love learning about, you’ll love my training. I’m offering a 75% discount to my blog readers if you click from here. I’m also available for consulting if you just don’t have time for that, and need to solve database performance problems quickly. You can also get a quick, low cost health check with no phone time required.
Goosebumps.
Think baseball.
I balk at your thoughts.
Sounds like I’ve got a man in scoring position.