Driven to Abstraction
Query plans are generally amusing things in SQL Server.
They aggregate huge amounts of information (in XML!), and then draw it up into a pretty picture that we make a living trying to understand.
Live query plans show you what your query is doing while it’s running.
Sort of.
They don’t show blocking.
Hidden Run
They also don’t show spills. Say I’ve got a query running, and it’s taking a long time.
I’ve got live query plans turned on, so I can see what it’s up to.

Hm. Well, that’s not a very full picture. What if I go get the live query plan XML myself?
SELECT deqs.query_plan
FROM sys.dm_exec_sessions AS des
CROSS APPLY sys.dm_exec_query_statistics_xml(des.session_id) AS deqs;
There are three operators showing spills so far.

Frosted Tips
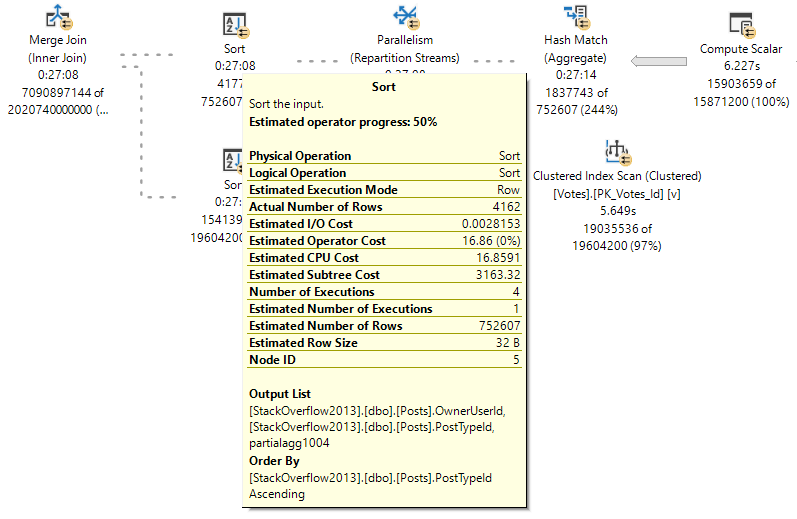
Even if I go look at the tool tips for operators registering spills, they don’t show anything.

It’s fine if SSMS doesn’t decide to re-draw icons with little exclamation points, but if information about runtime and rows processed can be updated in real-ish time, information about spills should be, too.
Thanks for reading!
Going Further
If this is the kind of SQL Server stuff you love learning about, you’ll love my training. I’m offering a 75% discount to my blog readers if you click from here. I’m also available for consulting if you just don’t have time for that and need to solve performance problems quickly.